Using the logging24 web UI
The logging24 web UI is the interactive workspace for exploring logs, refining searches, plotting captured values, and inspecting matching events. It uses the same query model described in Querying , but presents it as an operator workflow instead of a command surface.
This page is a guided walkthrough of the UI states currently documented in the available screenshots: login, search setup, histogram-backed analysis, and filtering directly from selected log text.
1. Sign in
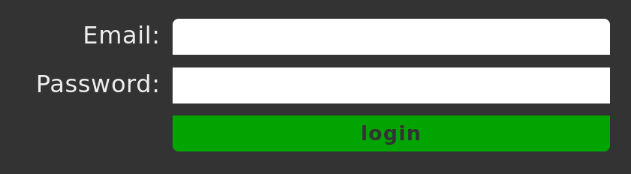
The login screen is on the top right. Just sign in with email, password.
After authentication you land in the overview workspace
Click "search logs" to go to the Query inteface, which is where most day-to-day investigation happens.
2. Build and run a query
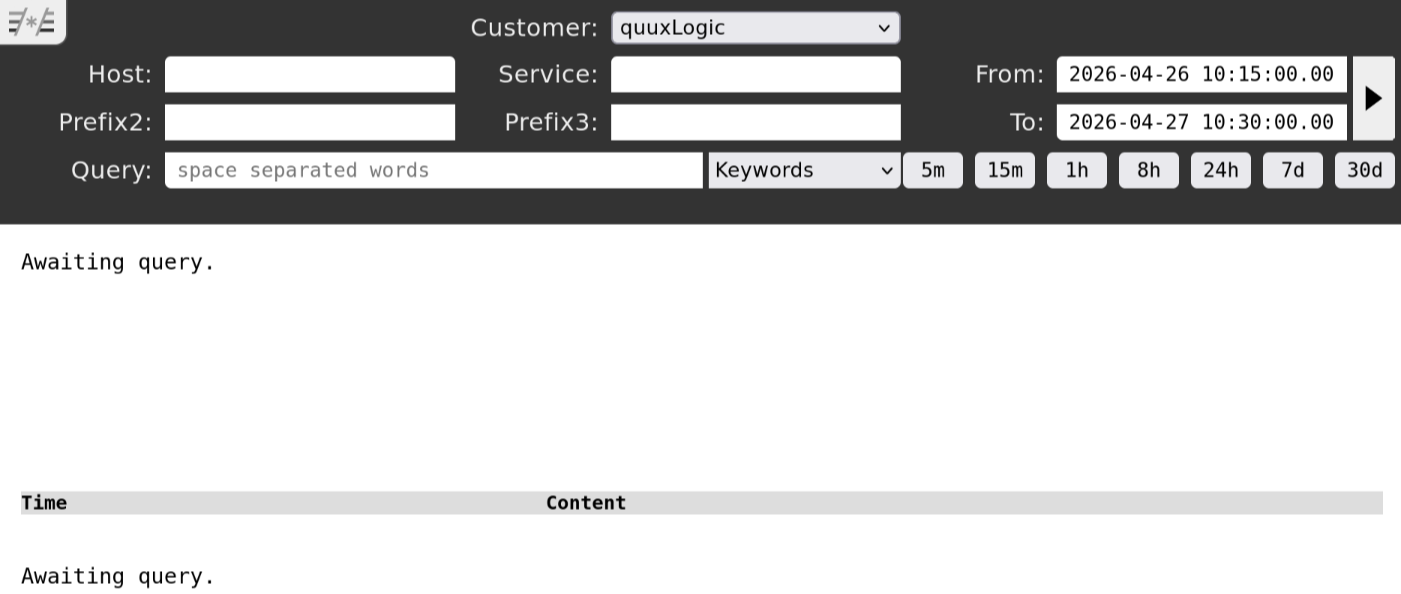
The main search screen exposes the important query dimensions directly:
- Customer selects the dataset to search.
- Host , Service , and the additional prefix fields narrow the set of streams before the full-text query is applied.
- From and To define the time window.
- Query contains the search expression, with a mode selector beside it.
-
The time buttons from
5mthrough30dare shortcuts that select a trailing interval ending at the current time. -
Pressing
Returnexecutes the query. - The play button enables live updates and reruns the query continuously, which is useful when watching fresh results arrive.
A practical workflow is to choose the customer, broadly constrain the time range, if known add the prefixes you know, and then thin out and filter your query to investigate.
3. Query modes
The query field supports multiple modes selected from the dropdown:
| Keywords | Find lines containing all given words, regardless of order. |
| JSON | Build a search aimed at JSON-shaped logs and key/value matches. |
| Regex | Work directly with the generated or hand-written regular expression. |
All modes ultimately produce a regular expression. If you switch from
Keywords
or
JSON
to
Regex
, you can inspect the translated query.
Keywords: database error
becomes: (.*database.*)&(.*error.*)

JSON: key:value
becomes: (.*key[^\"]*\": *\"[^\"]*value.*)
Practical regex fragments that come up often:
.*
|
Match any count of any characters. |
[^\"]*
|
Match any number of non-quote characters, useful when staying within a JSON string or key/value span. |
[^}]*
|
Match until the next closing brace when narrowing a JSON-shaped region. |
4. Plotting and histogram analysis
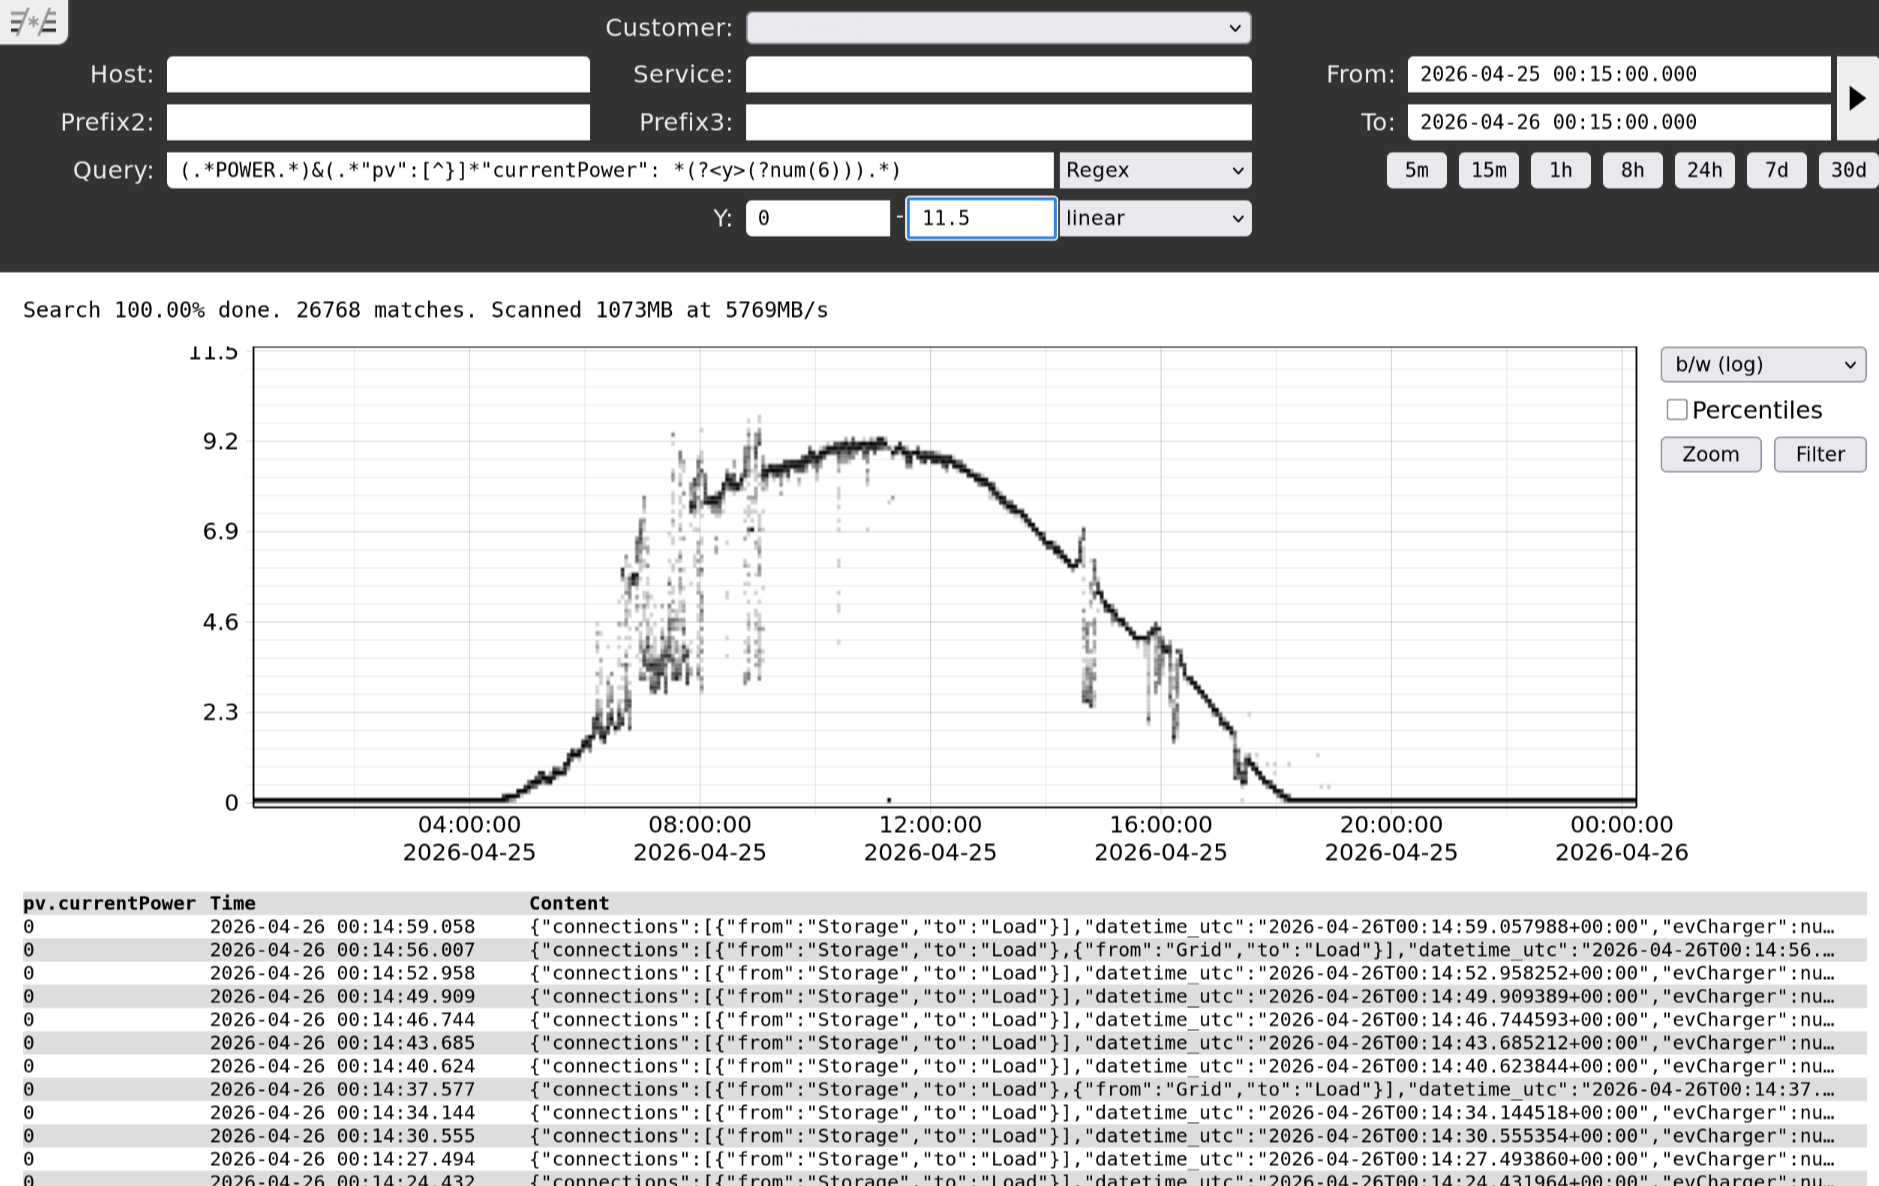
If your pattern captures numeric values, the UI can plot them over time. For example:
.*loop time=(?<y>(?num(3))).*When a numeric capture is present, the UI shows controls for the Y axis range and for switching the scale between linear and logarithmic display.
Once the query completes, the result area shows:
- Search progress and scan statistics.
- A histogram or numeric plot built from the captured values.
- A crosshair cursor over the plot to read values along the axes.
- Controls for display mode, percentiles, zoom, and filtering.
- The matching log rows below the chart.
Dragging on the plot enables X and Y zooming. If
Filter
mode is active on the right side of the plot, you can paint regions of the graph and rerun the query so that only the log lines responsible for those colored parts remain visible.
5. Inspecting results and filtering from selections
The result list at the bottom is not just static output. Each row can be expanded or collapsed, and JSON-looking data is decoded by the UI for easier inspection.
-
By default the UI shows a limited number of rows, then offers
load moreor infinite scrolling behavior. - If a line looks like JSON, clicking JSON values can add UI columns for those fields.
-
The
data.rawfield contains the raw bytes received for the event.
The UI also supports filtering directly from text you select inside a rendered log line.
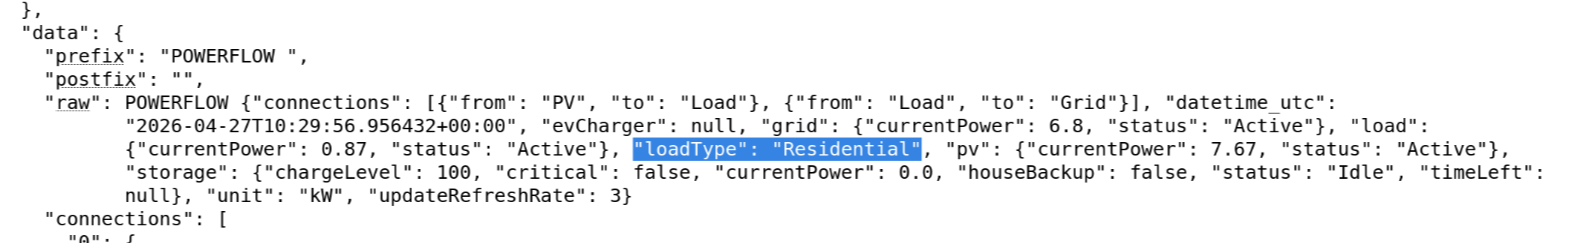
After selecting text, clicking the selected area opens direct actions for that fragment.
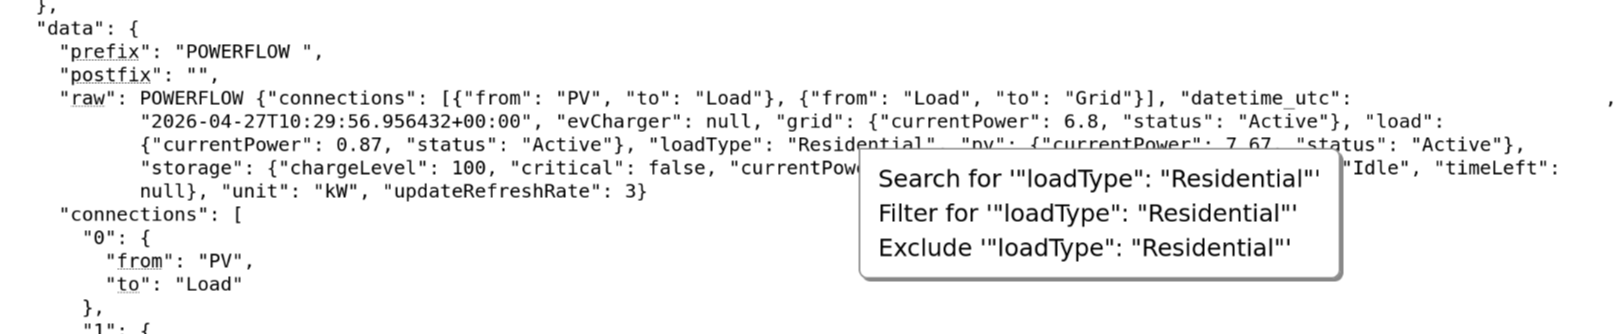
Those actions let you:
- Search explicitly for the selected text.
- Filter the current results by adding the selected text to the active query.
- Exclude lines containing the selected text from the current result set.
Working habits
| Start wide | Constrain customer, prefixes, and time range if known then refine the query. |
| Use mode switching |
Start in
Keywords
or
JSON
when convenient, then switch to
Regex
to inspect or refine the generated expression.
|
| Prototype in the UI |
Validate prefixes, regexes, and captures interactively before moving the same logic into
l24 query
or API calls.
|
| Use visual filtering | When plotting numeric captures, zoom and filter on the graph before drilling back into the responsible raw events. |
| Filter from evidence | Select text directly from a matching line when you want to refine the query based on an observed value rather than typing it manually. |