Observability Better answers without adding more tooling.

One tool.
Better observability.

logging24 stores your logs once, then lets you search incidents, create metrics, and alert on the same underlying data. The result is an observability approach centered on faster answers , less pipeline work , and lower cost .
Where observability is often split into logs, metrics, and traces as separate signals, logging24 uses one retained source of truth so those capabilities reinforce each other instead of living in separate systems.

Single source of truth observability Logs flow into one retained dataset and power search, metrics, alerts, and correlation. One retained source of truth app.log journal json log store single copy metrics search alerts correlation stays connected
Core Benefits

Observability outcomes that matter in practice

Search, metrics, alerts, and long retention in one tool at a fraction of the cost

Always get answers in milliseconds

01. Incident Investigation

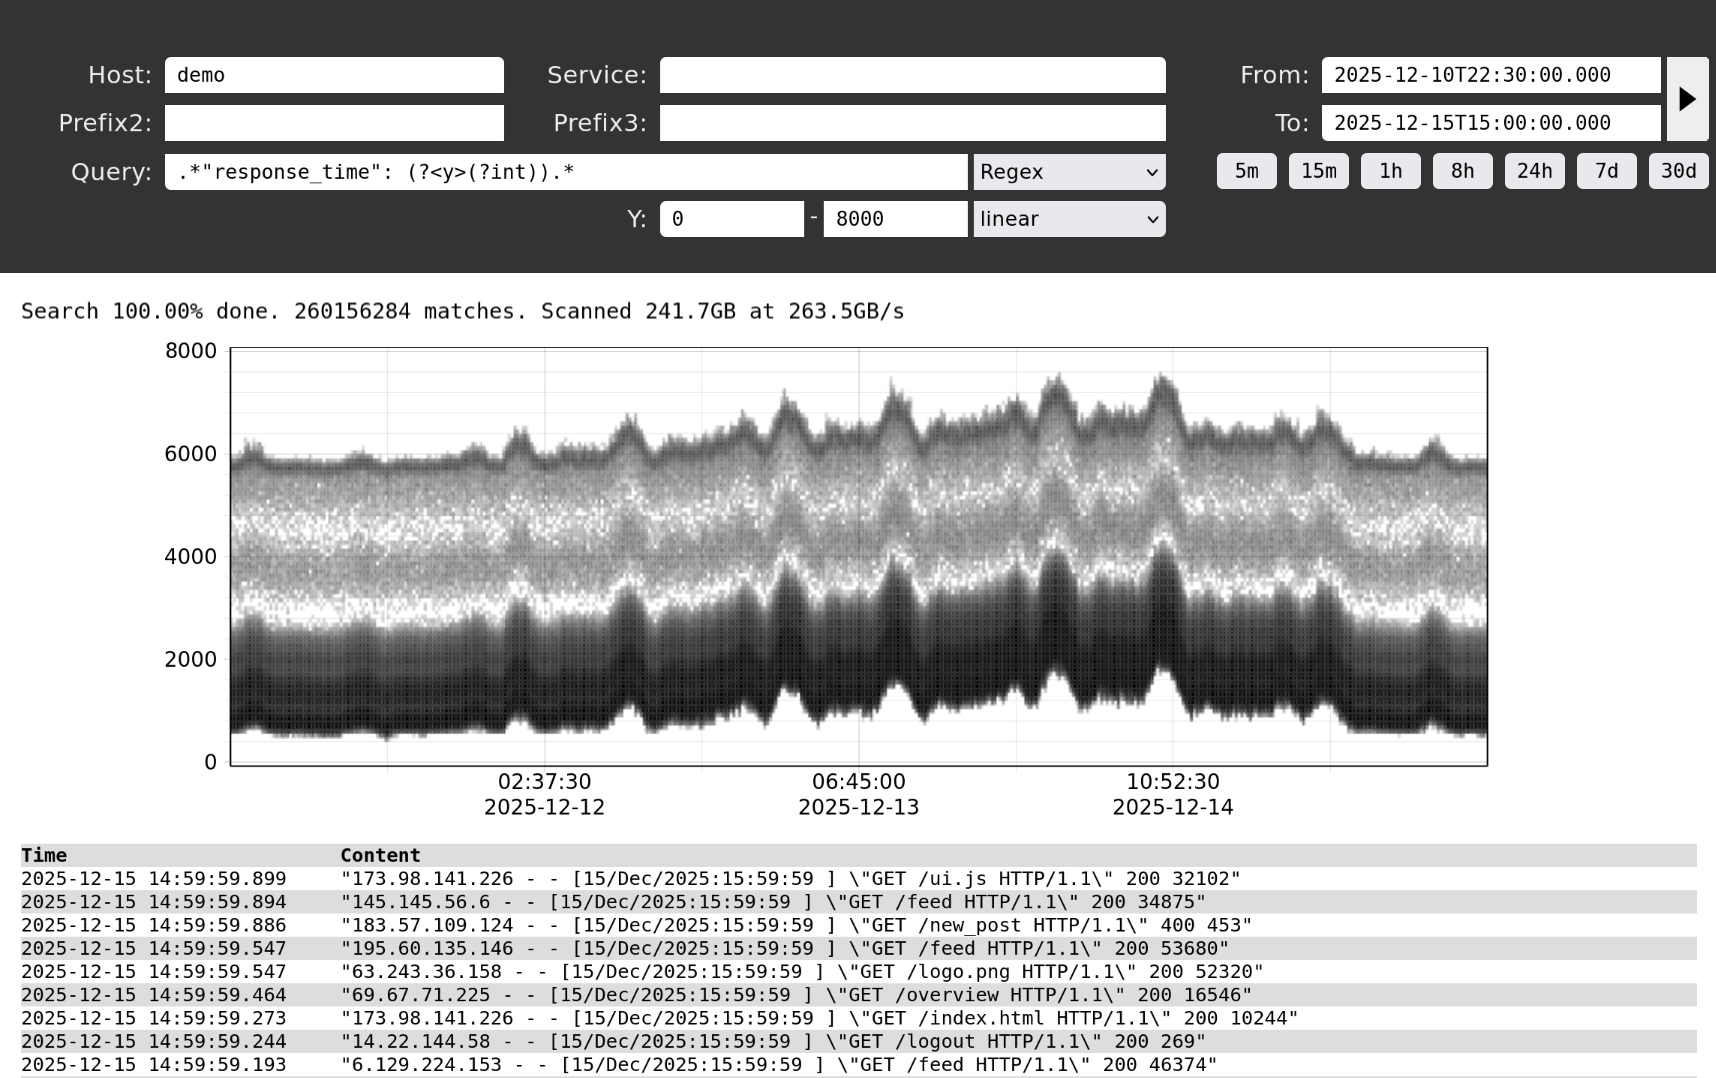
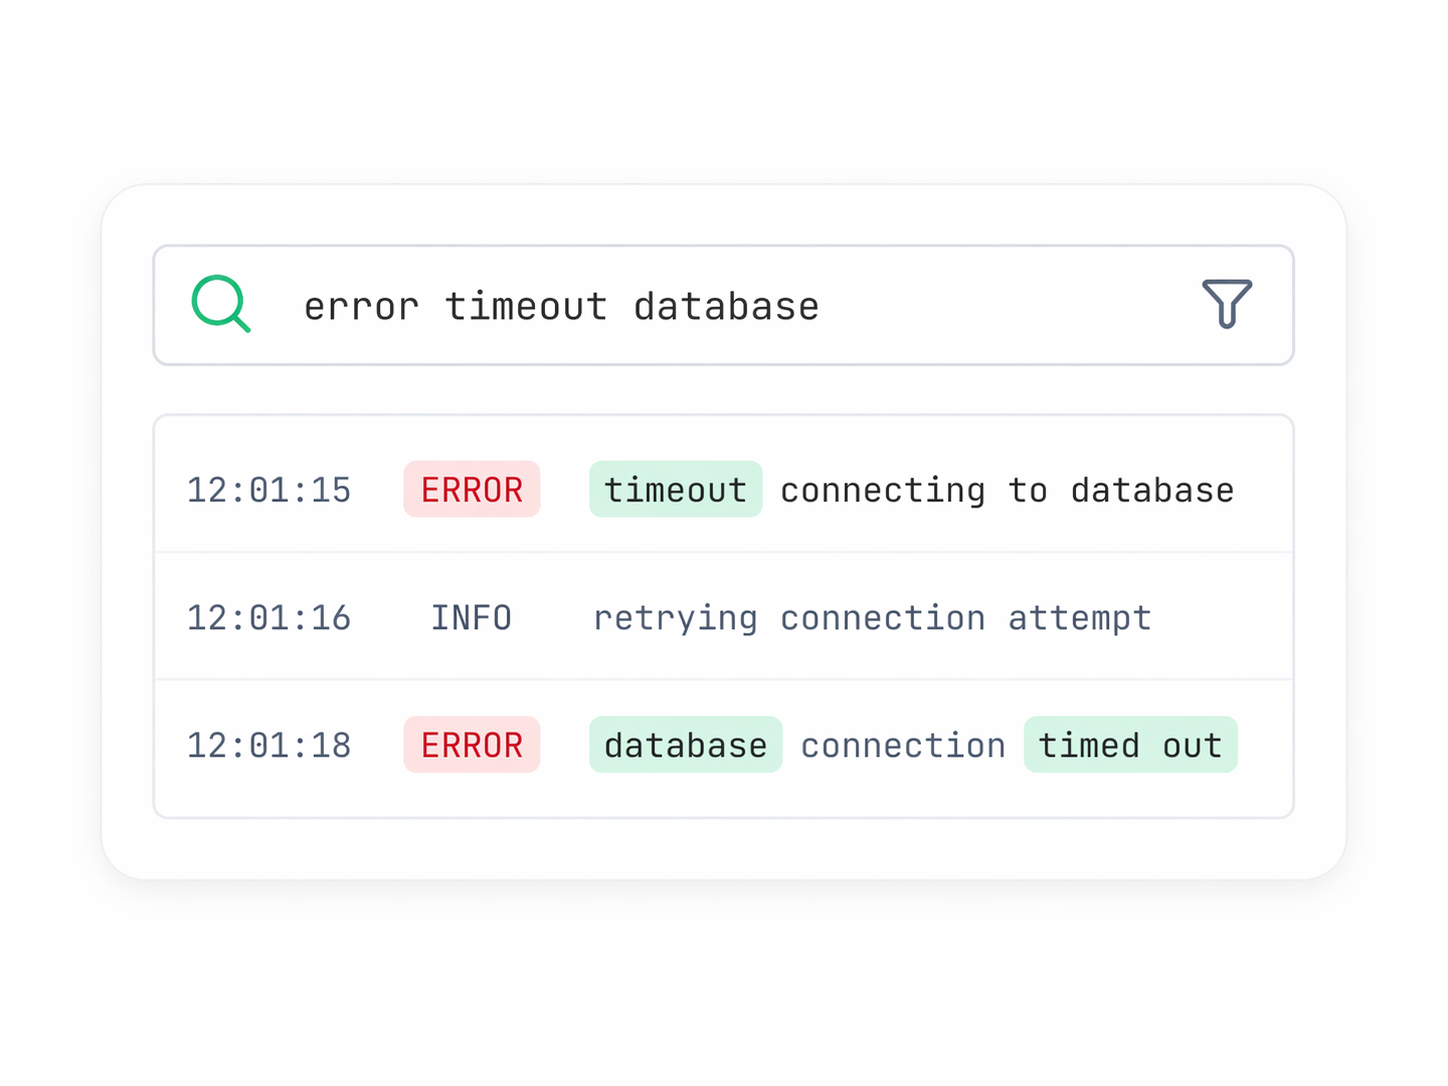
Find incidents fast from raw events

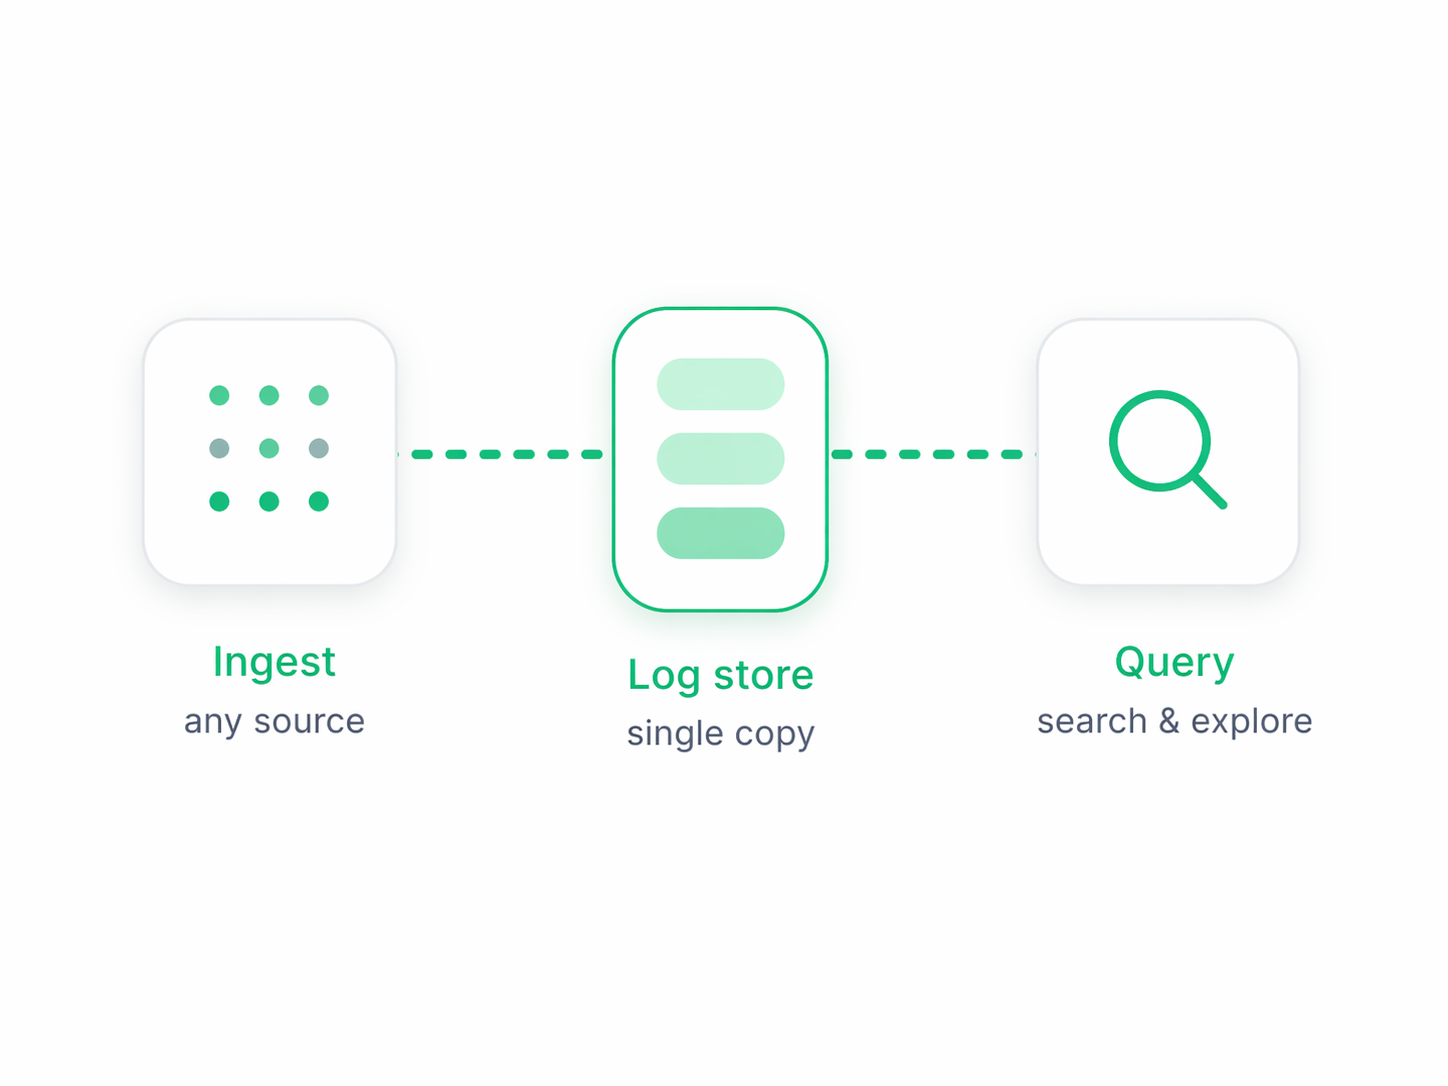
Good observability starts with being able to answer operational questions quickly. logging24 keeps full log detail searchable with fast regex-based queries, so teams can investigate incidents without waiting for re-indexing, field modeling, or preplanned dashboards.

Search all retained logs with full text and regex
No predefined facets or fields required
Keep edge cases visible instead of sampled away
Move from symptom to evidence quickly
Metrics without separate instrumentation

02. Late-Bound Metrics

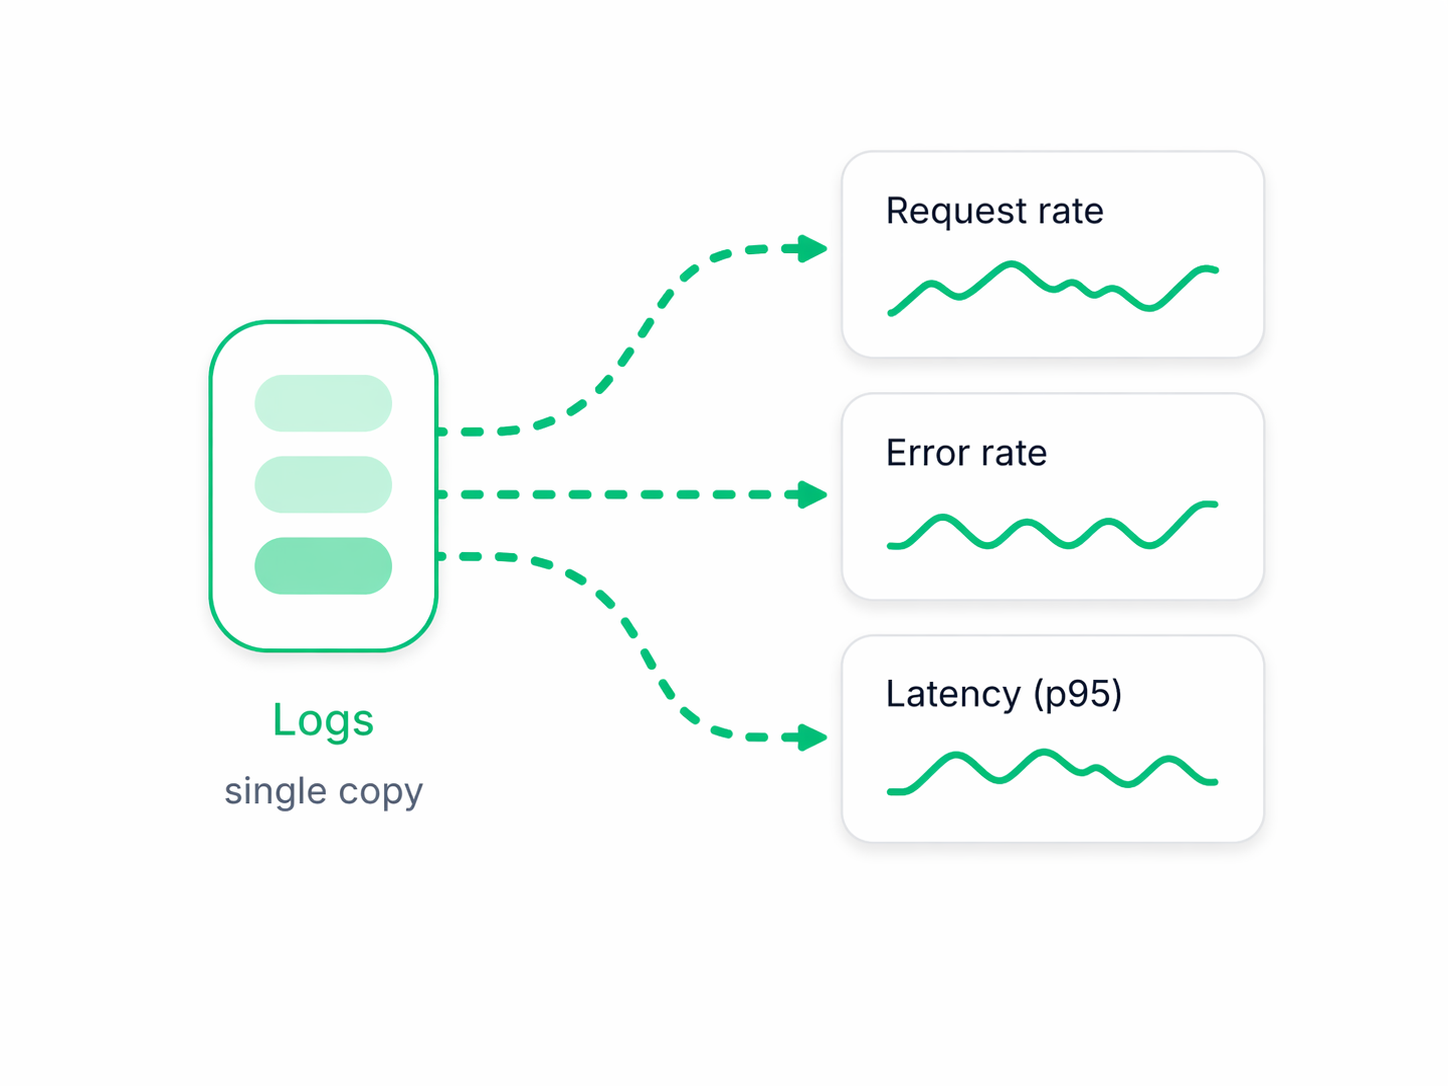
Create metrics after the fact

Many observability stacks force teams to decide in advance which fields deserve metric pipelines. logging24 takes the opposite approach: keep the raw events, then extract numeric values when the need appears. That makes new metrics possible during an incident, not only before one.

Turn any logged number into a metric later
Build histograms and time-series from existing logs
Avoid separate metric extraction pipelines
Reduce pressure to predict future questions
Explore freely. Stay in the flow.

03. New Questions

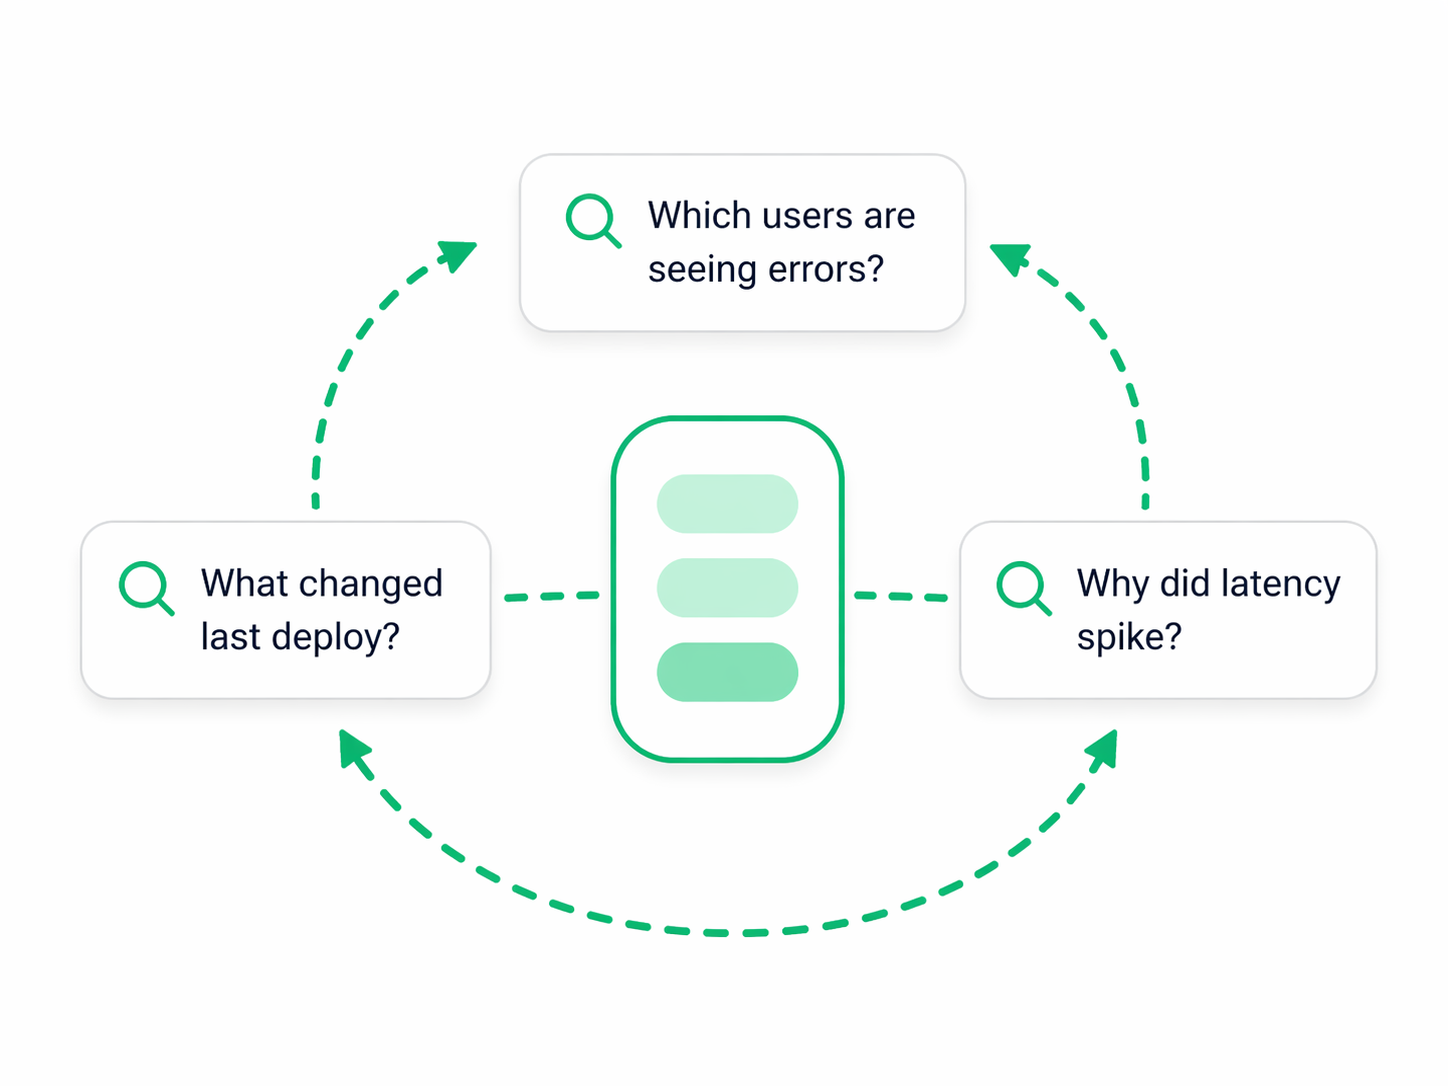
Ask new questions on existing data

Observability is most valuable when the unknown question arrives. With one retained dataset, teams can come back later with new search patterns, grouping keys, and derived metrics instead of rebuilding collection rules or reprocessing old data.

Reuse existing data for new investigations
No schema redesign when priorities change
No emergency pipeline changes during incidents
Better support for exploratory debugging
Simpler stack. Lower overhead.

04. Operational Simplicity

Start quickly and scale cleanly

Observability architecture should get simpler as systems grow, not more fragile. logging24 uses one forwarding path and one query model from single-host setups to multi-terabyte environments, so teams spend less time stitching tools together and more time operating systems.

Forward logs once and reuse them for multiple needs
Keep the same workflow from small to large deployments
Fewer moving parts in the observability path
Less operational overhead around ingestion and indexing
Complete coverage. No blind spots.

05. Unified Coverage

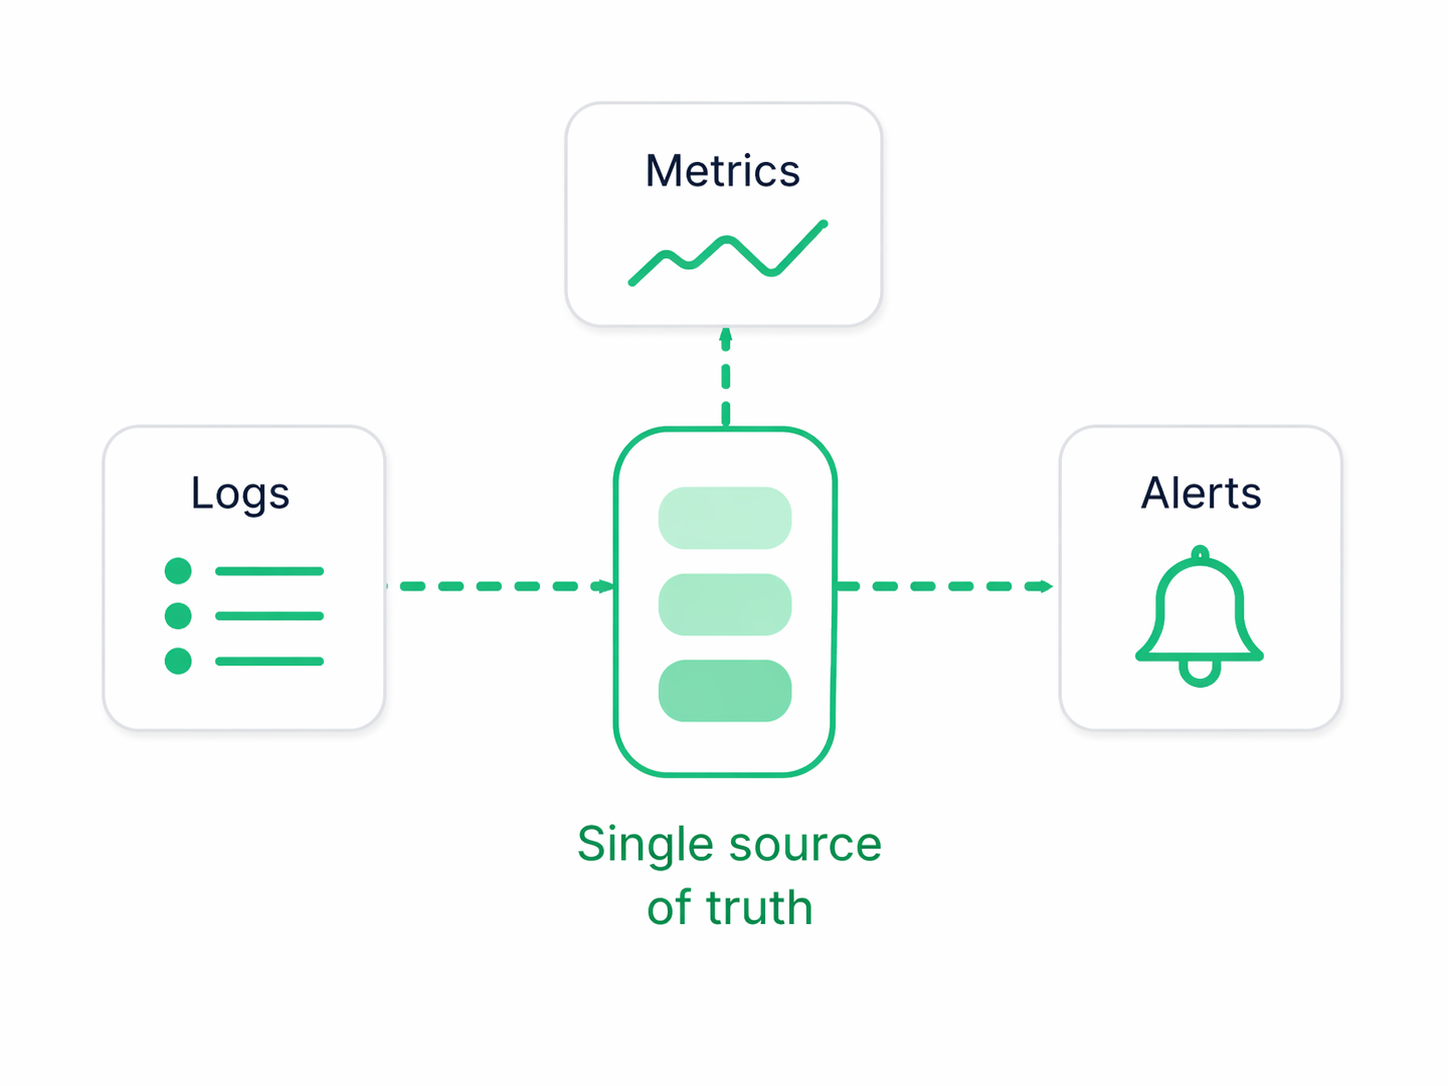
Use one dataset for logs, metrics, and alerts

The observability benefit is not “more telemetry types.” It is having one place where troubleshooting, monitoring, and alerting reinforce each other. logging24 uses retained log events as the shared source so teams can move between investigation and monitoring without switching mental models or data stores. In practice, that means the traditional signals still matter, but they are powered from the same underlying data: logs remain the raw evidence, metrics are derived when needed, and trace-like correlation can be pursued directly from the recorded events.

Investigate incidents and build alerts from the same data
Let logs, metrics, and correlation work from one source of truth
Keep monitoring grounded in retained raw events
Reduce handoffs between separate observability systems
Spend less time correlating across tools
Save up to 80% cost on observability.

06. Cost and Control

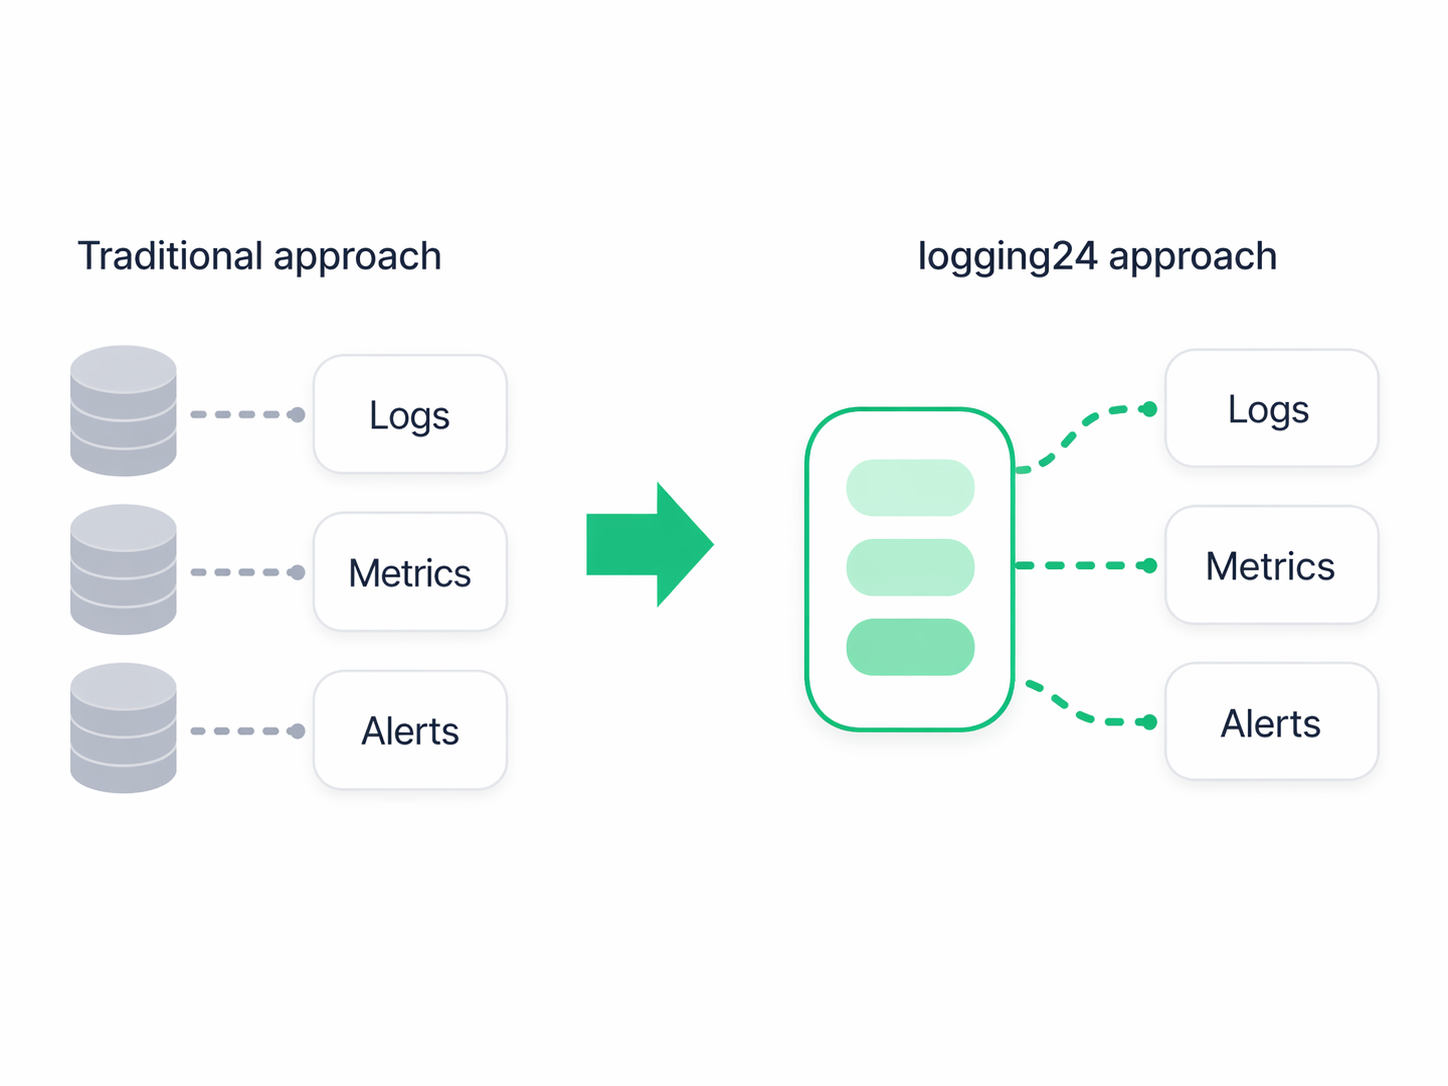
Keep full detail without index-heavy pricing

A useful observability platform has to remain economically viable at retention and throughput levels real teams need. logging24 keeps one copy of the data, avoids indexing overhead, and offers predictable pricing so teams can retain detail without treating observability as a luxury.

Cut observability cost by up to 80%
Keep raw detail instead of dropping data
Predictable storage and scan pricing
EU-hosted infrastructure in Germany and Finland
Working Model

One view for investigation and monitoring

Search incidents, derive metrics, and follow correlation paths in the same environment instead of splitting logs, metrics, and traces across separate stacks

Comparison

Benefit-oriented observability vs. fragmented stacks

The question is not how many tools you can connect, but how much work they create

Outcome Fragmented stack logging24
Incident response Search depends on pre-indexed fields and multiple tools Search retained raw logs directly
New metrics Requires separate metric design and collection Extract from logs when the need appears
New questions Often means schema or pipeline changes Query existing retained data again
Operational complexity Multiple agents, stores, and query languages One forwarding path and one core query model
Data retention Tradeoffs between cost, sampling, and fidelity Keep one full copy of raw events
Cost control Index-heavy pricing and duplicated storage €0.25/GB stored
€50/PB queried
Hosting model Varies by vendor and stack composition Fully managed, EU-hosted

Build observability around outcomes, not more tooling

If you want search, metrics, and alerts without more pipeline work, we can walk through how logging24 fits your current stack.

Talk to us about observability goals

Tell us what you need to investigate, measure, or alert on. We can map the platform to your current observability setup and the benefits you care about.

Location EU-based servers in Germany & Finland