Complete Observability. Straight From Logs.
save 80% in days – get better answers for years
Problems we solve
As products scale, logs and metrics explode in volume — and costs quickly become unsustainable. Teams spend precious engineering time cutting cardinality and trimming data just to stay afloat.
All too often, this leads to blind spots in production. When an incident happens, the data you removed before is exactly what you needed. See below how logging24 solves this conundrum:
Your monitoring costs too much?
Reduce costs up to 80% and more within days.
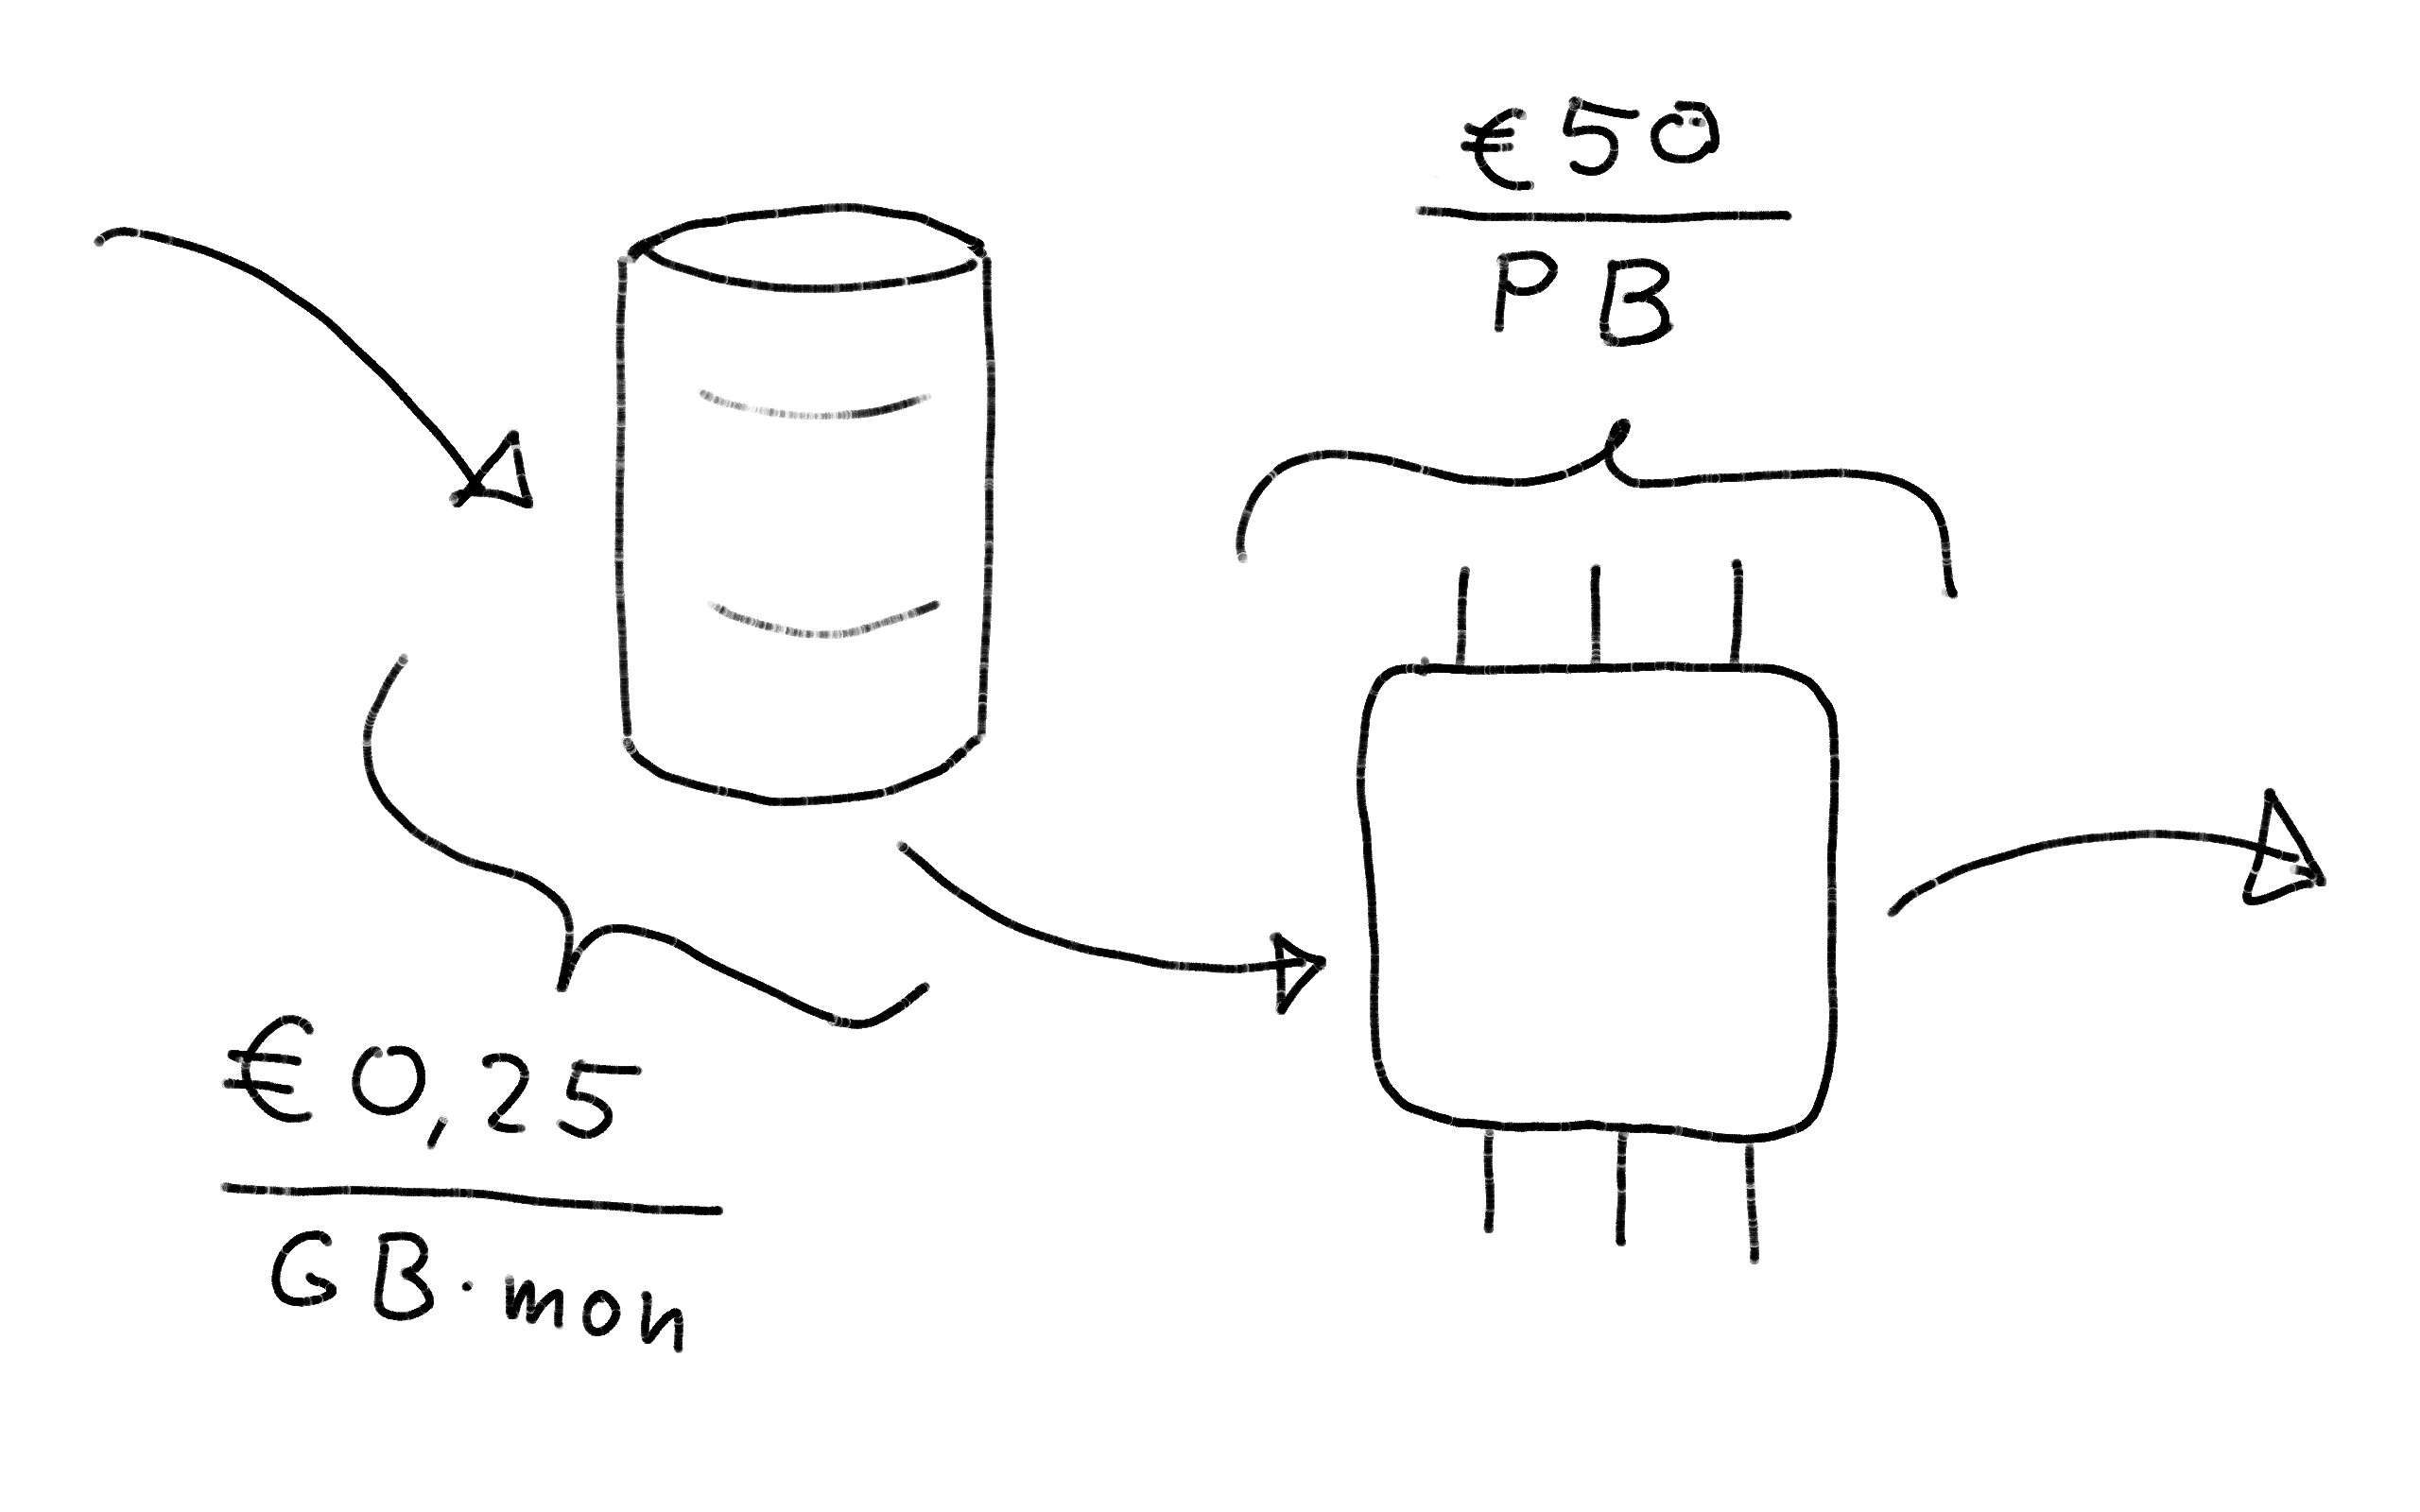
Logging24 costs about a fifth of other observability solutions:
€0.25/GB·month for storage, €50/PB scanned for compute.
We can offer these prices thanks to novel algorithms and an implementation hand-crafted with attention to detail — and performance.
Metric cardinality is a constant trouble?
Never worry about cardinalities again.
Query metrics from logs after arbitrary filtering. No predefined dimensions. No indices. No trade-offs.
By filtering on plain logs first and then aggregating millions of data points per second, logging24 sidesteps the cardinality problem entirely. Every text-filter is a dimension.

Need to get your data out of US control?
Your logs are staying 100% in the EU.
We run dedicated servers geo-redundantly in Germany and Finland, leased from EU-registered and EU-controlled hosting providers.
All logs are encrypted in transit and at rest with keys unknown to the hosting providers. All administrative commands are logged and audited.
logging24 in Numbers
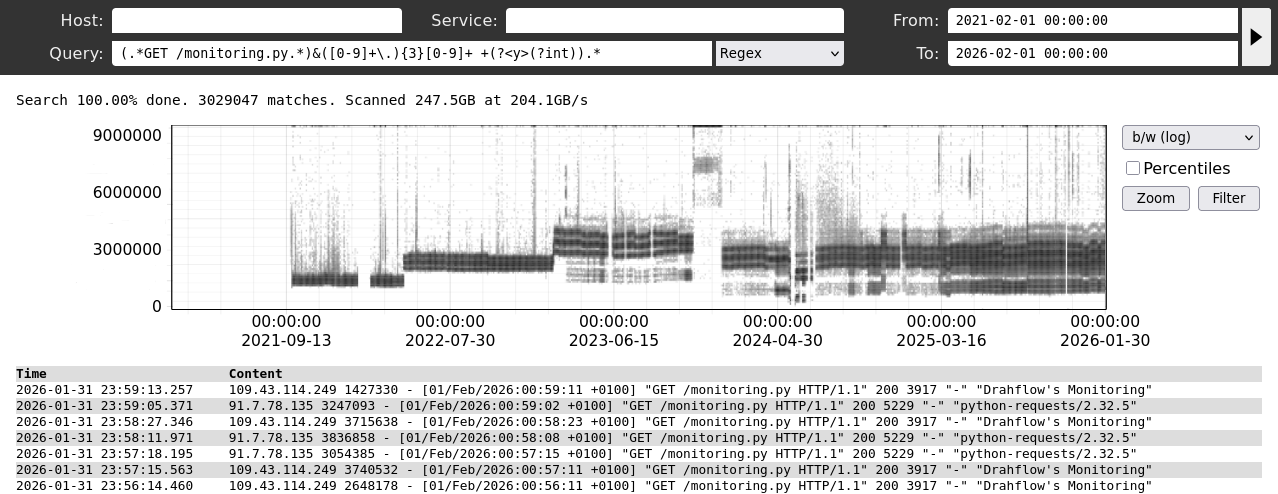
200 GB/s
scan speed
4 years
without incident
25482817092151
bytes stored

Logs expire before tickets are complete?
Keep logs as long as needed.
At 20% the price, you can keep logs around much longer and still pay less.
Our oldest logs are from 2021. And we query them with the same performance as those from yesterday.
Every new observability signal requires engineering effort?
Answer all questions from existing logs.
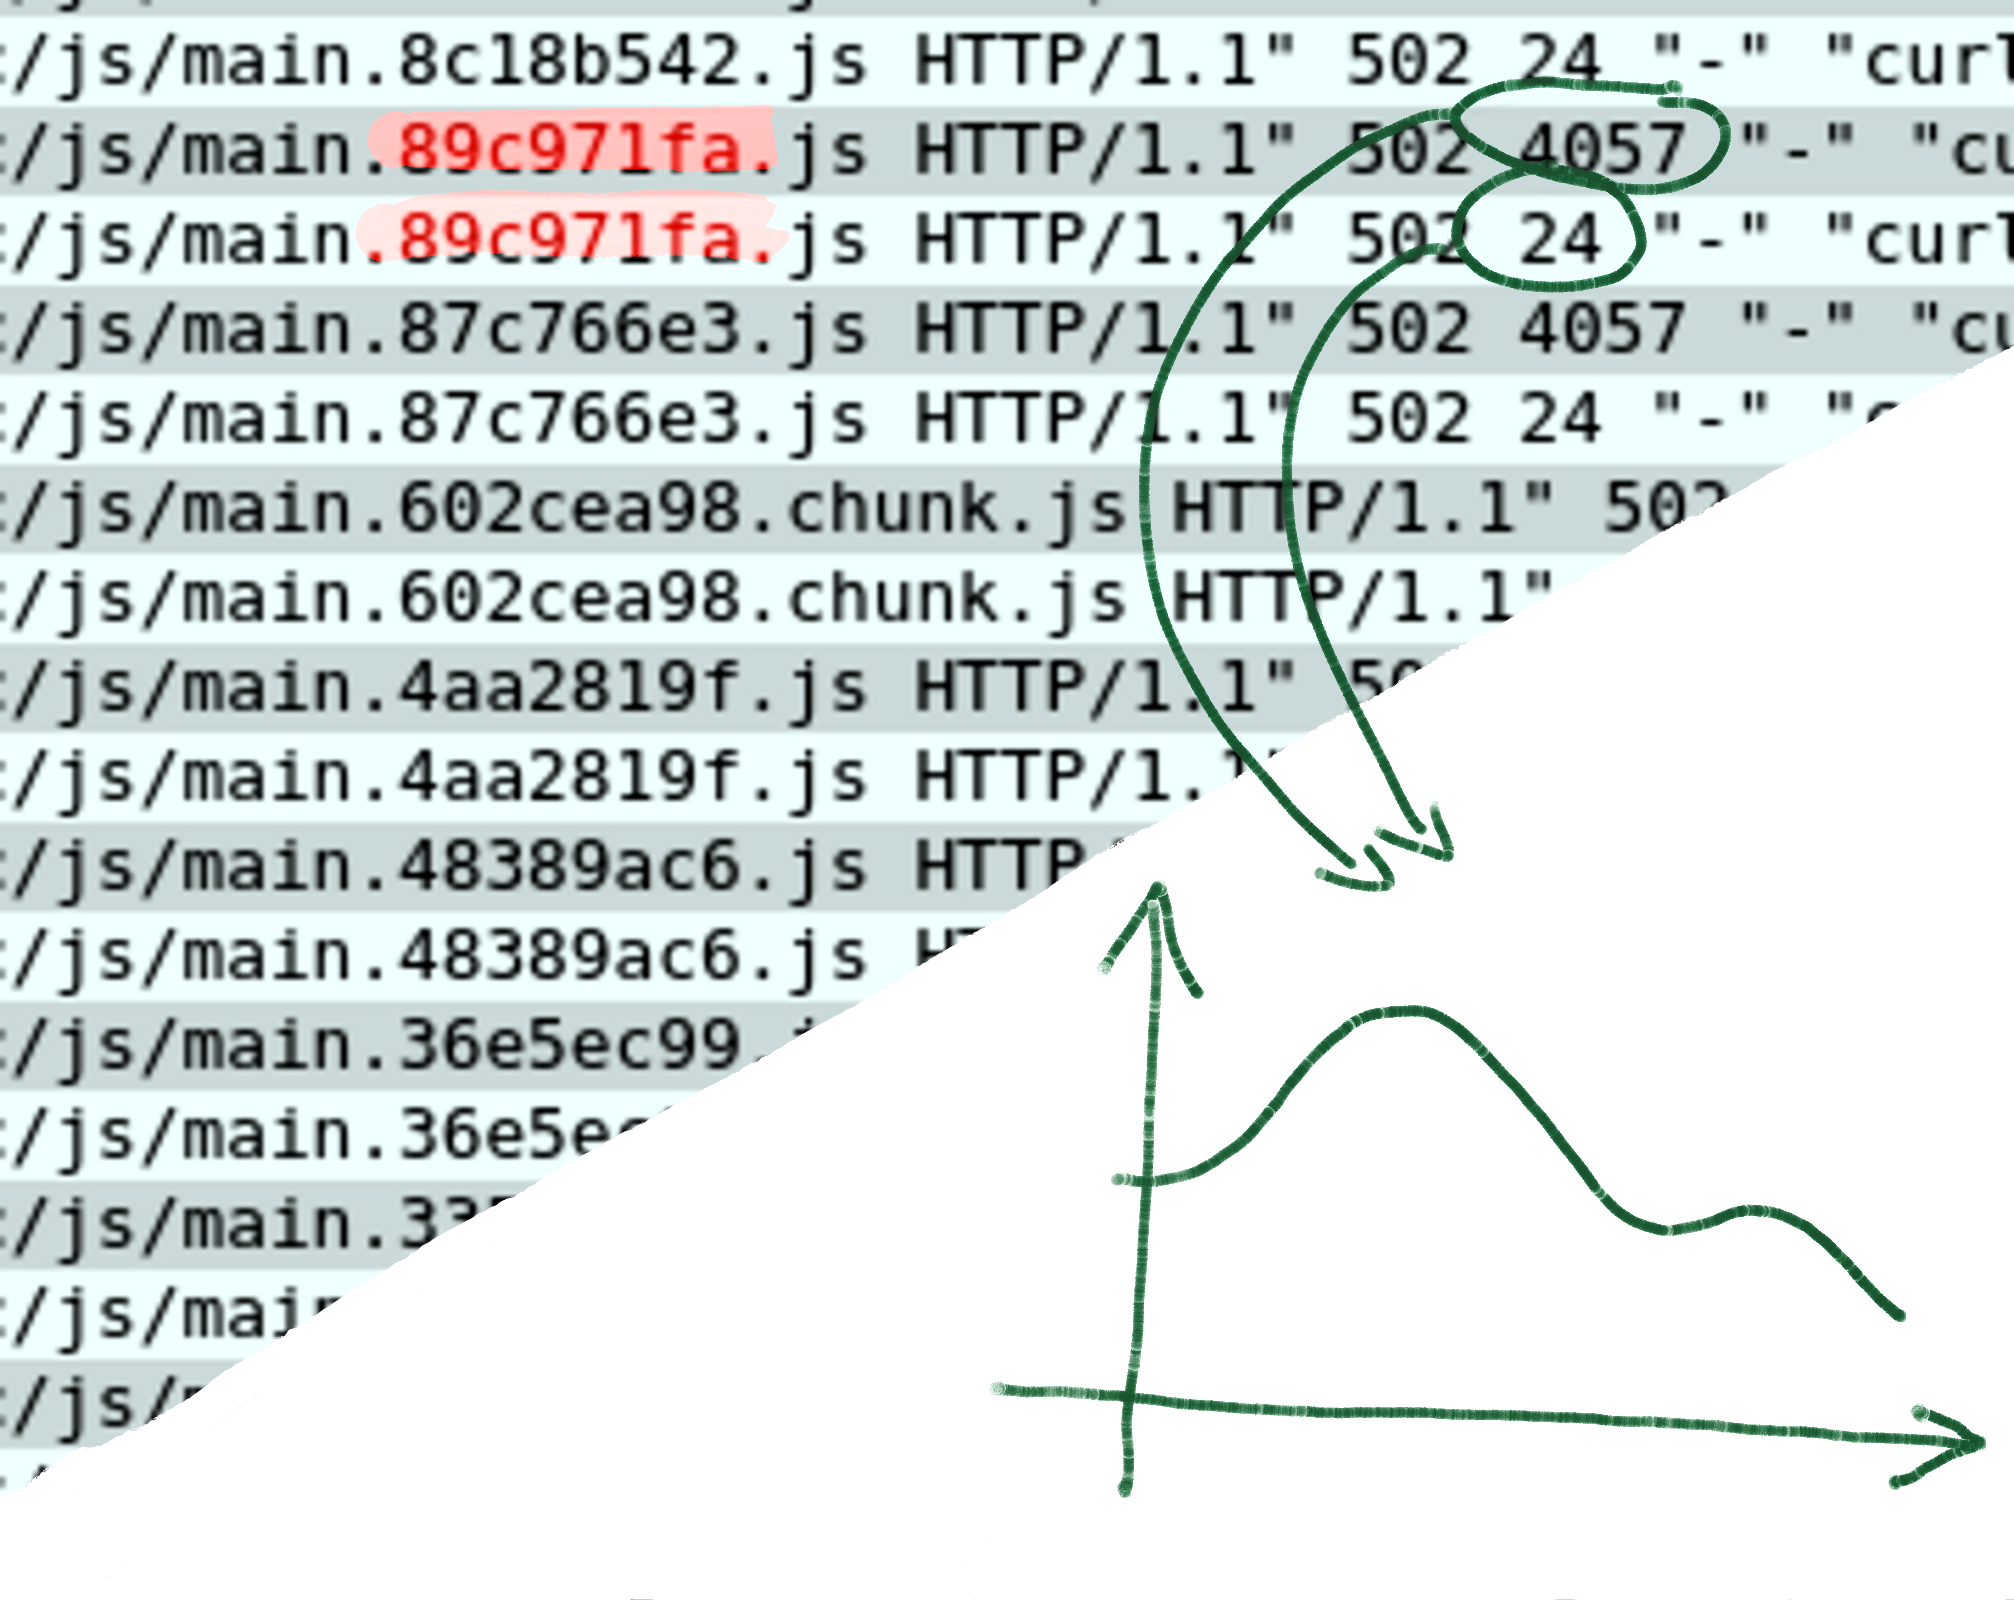
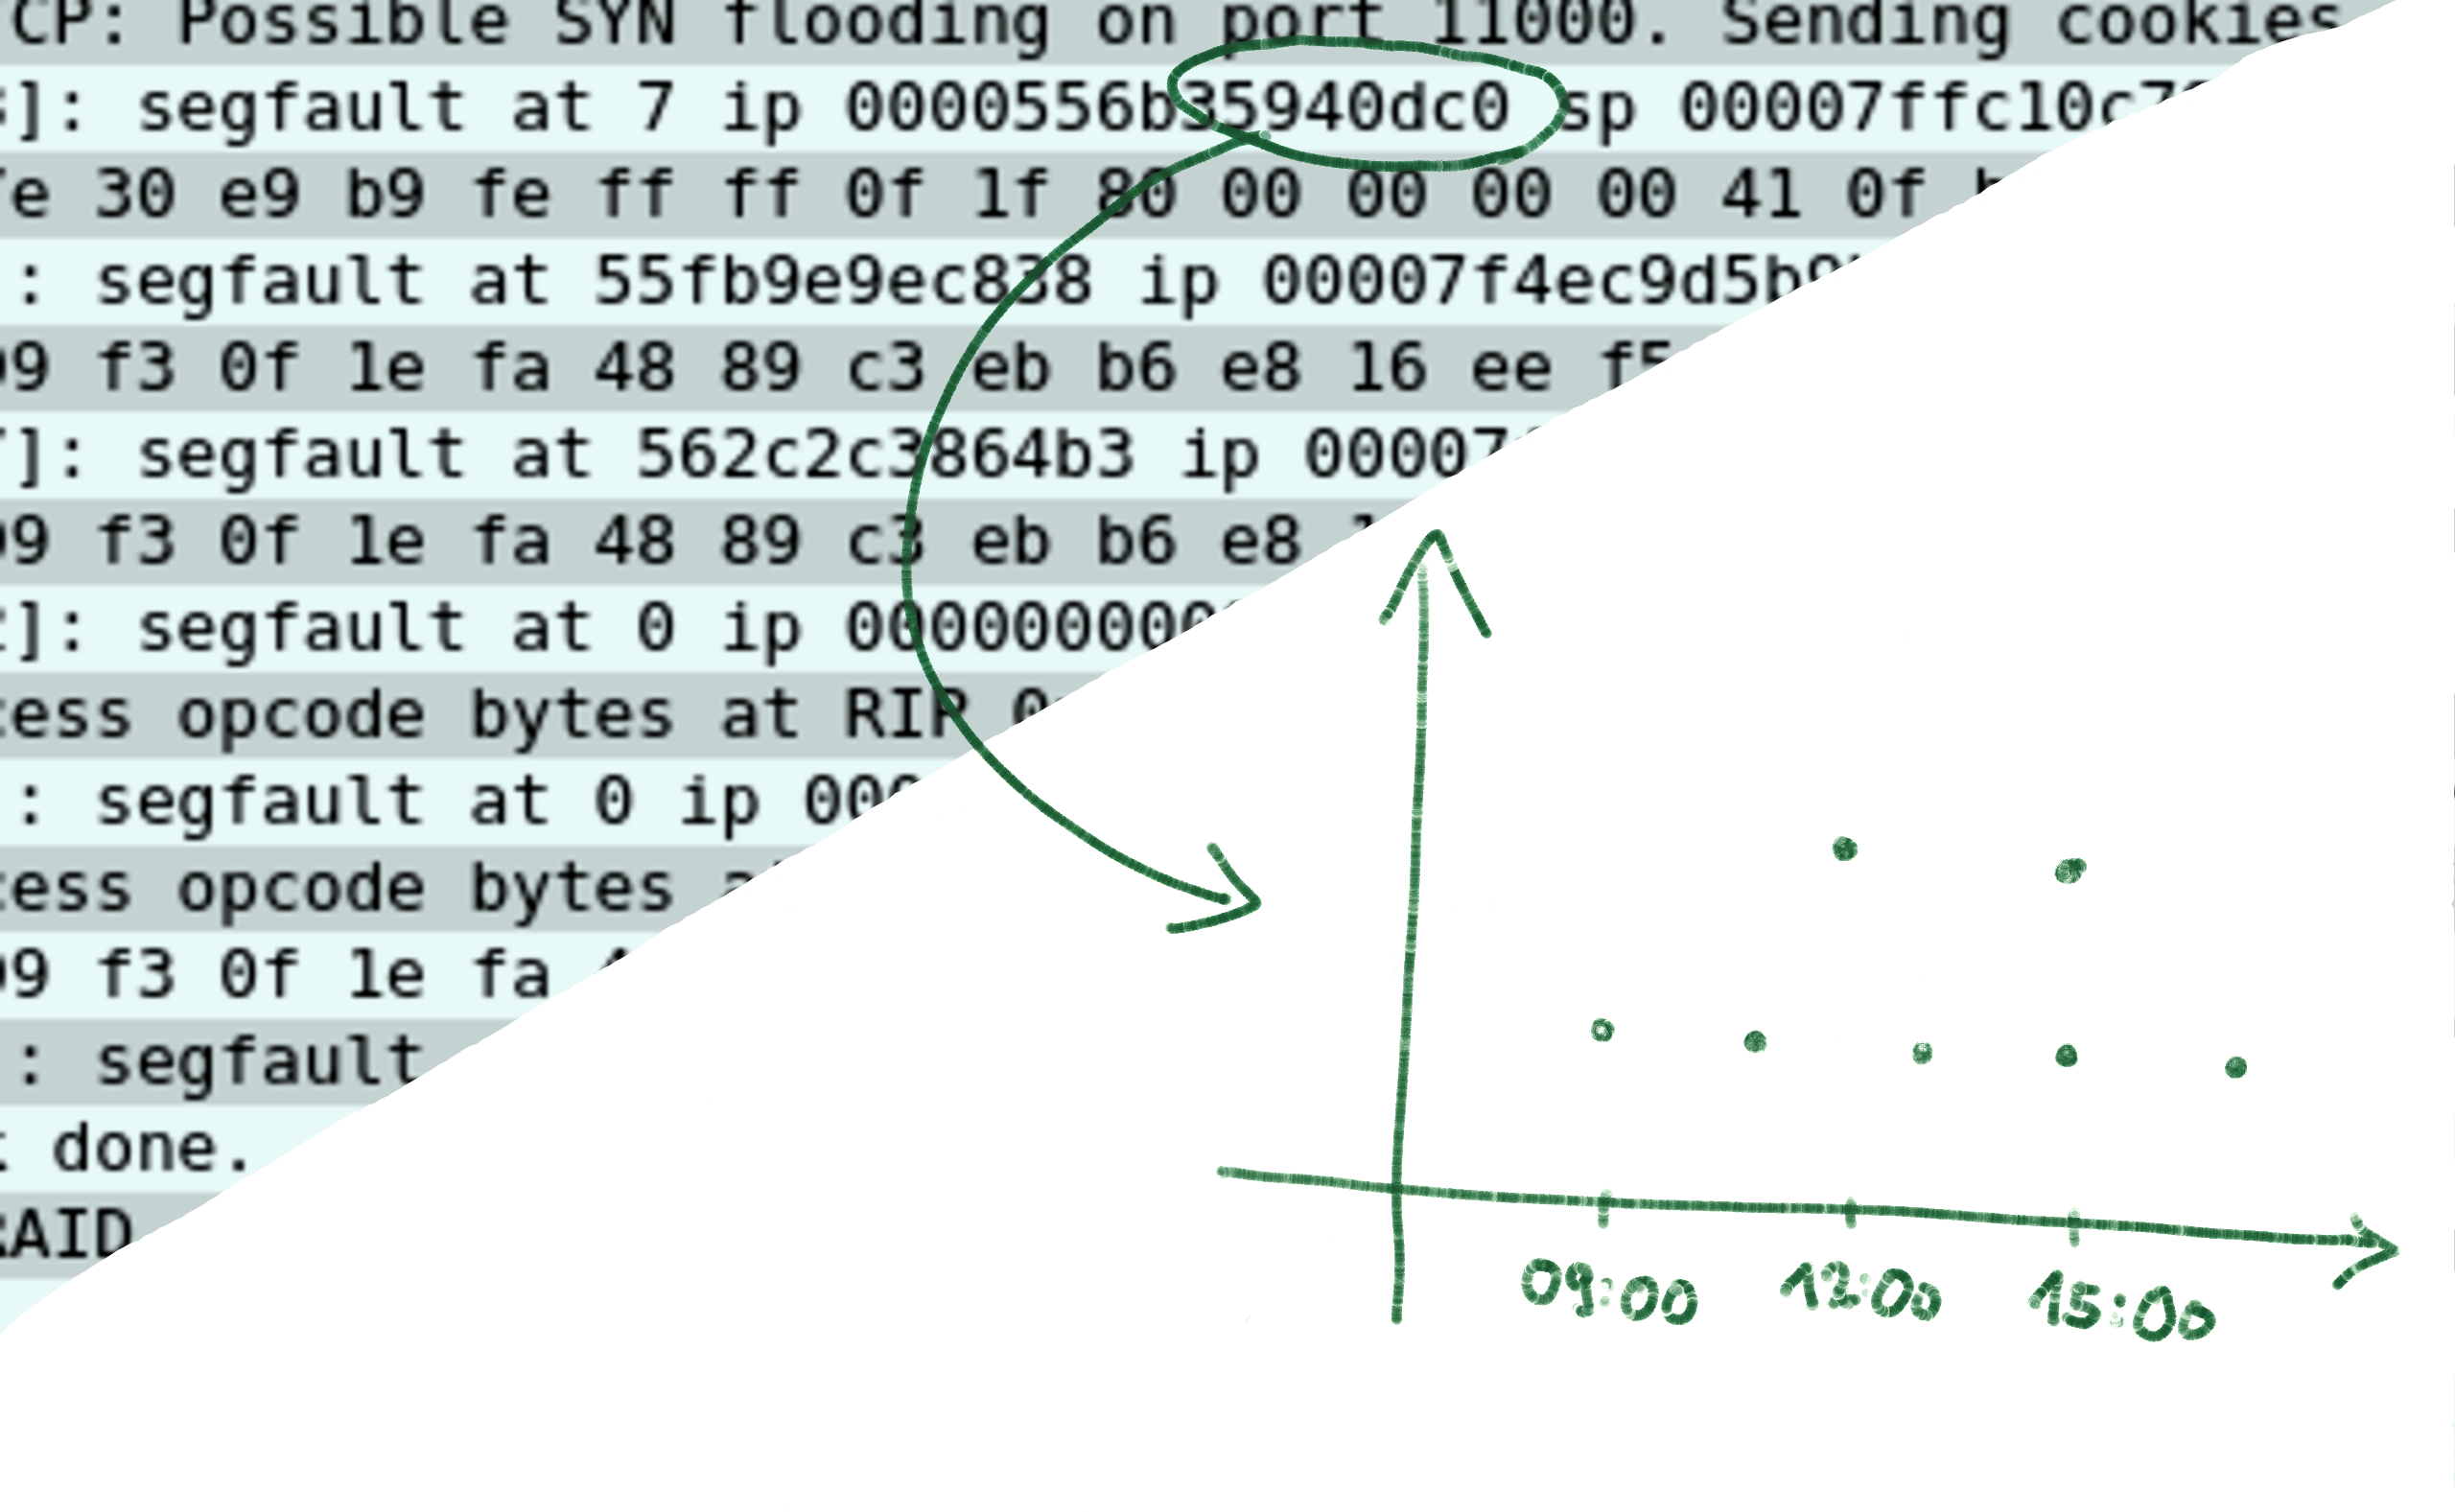
With the flexibility of regular expressions, logging24 can extract errors, metrics and correlations from the logs you already have, no matter their format.
Metric generation doesn't need to be planned, either. Instead you query whatever metric the situation requires — even from logs written long ago.

Your self-hosted observability is too slow?
Never care about observability resources again.
By sharing a large CPU pool across all our clients, logging24 delivers a maximum of compute exactly when you need it.
Of course, we also take care of upscaling, capacity planning, backups, and all the other little details necessary to keep your observability up and running.
Our Onboarding Process
Contract is signed.
NDA, GDPR roles, primary contact points clarified.
We help you configure log forwarding.
Webservers, applications, system logs, embedded devices.
You get the answers you need.
All logs available with maximum flexibility and speed.
Built by Experts

Jens-W. Schicke-Uffmann
- 22 years of observability experience
- 17 international publications
- PhD in computer science

Felix Klose
- 24 years of observability experience
- 20 international publications
- Diploma in computer science

Unsure?
Start today.
Trial is free. Do it before the next incident. Start logging today. Be ready for tomorrow.
Frequently Asked Questions
General
- No preprocessing or filtering required
- Query any field without pre-planning
- Handle format changes without losing data
- Extract metrics from any numeric field on-the-fly
Getting Started
- native Linux binary — recommended for production, high performance
- multi-arch Python tool — convenient cli, multi-architecture support
- Fluentd plugin — if you're already using Fluentd
- nothing - just point your existing promtail or rsyslogd at our ingest nodes
Technical
- All data is encrypted in transit (TLS) and at rest (dm-crypt)
- Access tokens use secure hashing — we never store the actual token
- Role-based access controls (Writer, Reader, Admin)
- Prefix-based permissions for fine-grained access
- EU-based infrastructure
- We host only at ISO 27001 certified datacenters
- Our systems are fully audit-logged
Pricing & Billing
You only pay for what you use — there are no overage penalties or surprise charges. Your bill scales linearly with your actual usage.
If needed, we can help you estimate your usage during onboarding and agree on a monthly price cap. Even then, we will never interrupt your log delivery without talking to you first.
Performance & Scale
The apparent query speed increases as more data is scanned. This is due to fixed latencies at query startup. Queries over large amounts of data usually proceed at 100s of GB/s. Naturally, overall duration will increase once the scanned data set becomes large enough.
By choosing the ratio between compute and storage, we can control the maximum query duration. Our current deployment strategy aims at 30s for a hypothetical full scan of all stored log data. As the resources are shared between customers, an analysis over all your logs, ever, will complete significantly faster.